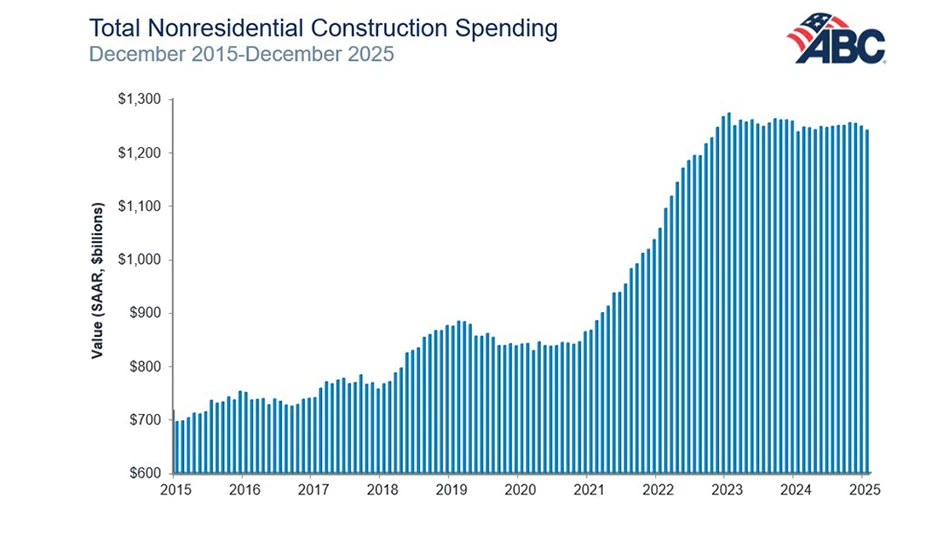
Associated Builders and Contractors (ABC) has reported that its Construction Backlog Indicator contracted to 8.1 months during January 2019, down 0.8 months, or 9.3 percent, compared to the fourth quarter 2018 reading of 8.9 months.
The Construction Backlog Indicator is a forward-looking national economic indicator that reflects the amount of work that will be performed by contractors in the months ahead.
“This represents the latest in a number of indicators suggesting that U.S. economic momentum has begun to wane,” says Anirban Basu, ABC’s chief economist. “Other data tracking retail sales, employment growth and the trade deficit suggest that in contrast to 2018, this year will not be as strong from an economic growth perspective.
“January’s decline in nonresidential backlog was significant, slipping to levels last observed in 2014,” Basu says. “From an industry segment perspective, the decline in backlog was especially sharp in the infrastructure category, which may have been related to the federal shutdown in January.
“There was one meaningful exception in the Middle States, where backlog continues to rise,” Basu continues. “This is potentially a result of stronger industrial production growth in 2017 and 2018, which has produced greater demand for modern industrial space. As with any January data release, weather may also have played a role in shaping the results. Accordingly, more clarity regarding contractual activity will arrive during the months ahead.”
Industry highlights:
- The commercial and institutional sectors’ indicator is at 8.1 months, down 9.9 percent from 9 months in the fourth quarter of 2018.
- The heavy industrial indicator is at 7.7 months, just slightly down 1.6 percent from 7.8 months in Q4 2018.
- The infrastructure indicator is at 8.5 months, dipping 11.1 percent from 9.5 months in Q4 2018
Regional highlights:
- The Northeast experienced the largest decline, with an indicator at 6.9 months, down 16.5 percent from 8.2 months in Q4 2018.
- The Middle States was the only region to experience growth, with a current reading of 7.4 months, up 3 percent from 7.1 in Q4 2018.
- The Southern and Western regions of the U.S. experienced significant declines as well. The West’s indicator is at 7.9 months, down 11.5 percent from 8.9 months in Q4 2018; the South’s indicator is at 9.8 months, down 12.7 percent from 11.2 months in Q4 2018.
Highlights by company size:
- Companies valued between $30 million and $50 million experienced the most significant decline in their indicator, dropping 41.4 percent from 12.3 months in Q4 2018 to 7.2 months in January 2019.
- Companies across the board experienced declines. Those valued less than $30 million dipped 7.7 percent; those valued between $50 million and $100 million declined 3.9 percent; and companies valued more than $100 million declined 3.4 percent.
Charts and a monthly graph tracking the national CBI rate is available on ABC’s website.
Latest from Construction & Demolition Recycling
- Waste Pro files brief supporting pause of FMCSA CDL eligibility rule
- Des Moines project utilizes recycled wind turbine blades
- Vecoplan to present modular solutions at IFAT 2026
- Terex Ecotec appoints Bradley Equipment as Texas distributor
- Greenwave raises revenue but loses money in Q2 2025
- Recycled steel prices hold steady
- John Deere launches ‘Building America’ excavator contest
- Triumvirate Environmental acquires Environmental Waste Minimization